Smart Social Distancing: New Codebase Architecture
This tutorial provides a technical overview of the latest codebase architecture of the Galliot’s Smart Social Distancing application powered by AI on Edge.
This is Galliot’s solution for Detecting Social Distancing violations.
Visit our GitHub repository to read the application setup guide.
Read about the Data Labeling Methodologies and Solutions to learn how you can address your data requirements.
As a response to the coronavirus (COVID-19) pandemic, Galliot has released an open-source application that helps people practice physical distancing rules in different places such as retail spaces, construction sites, factories, healthcare facilities, etc. This open-source solution is now available as part of a standalone product at Lanthorn.ai.
This tutorial provides a technical overview of the approach to Smart Social Distancing. If you want to skip the implementation details, head to our GitHub repository to read the Smart Social Distancing application setup guide. You can read about our previous application architecture (outdated) in this article.
Note: Familiarity with deep learning computer vision methods, Docker, and edge deep learning devices, such as Jetson Nano or Edge TPU, is recommended to follow this tutorial.
1. Problem Description
Social distancing (also physical distancing) is one approach to control and prevent the infection rate of different contagious diseases, e.g., coronavirus and COVID-19, which is currently causing one of the largest pandemics in human history.
Wearing facemasks and maintaining social distancing are the most effective solutions to contain the spread of COVID-19. However, enforcing these policies poses a significant challenge to policymakers.
Please visit this blog post to read more about why current approaches fail and why we need a more robust approach.
2. Smart Social Distancing Application
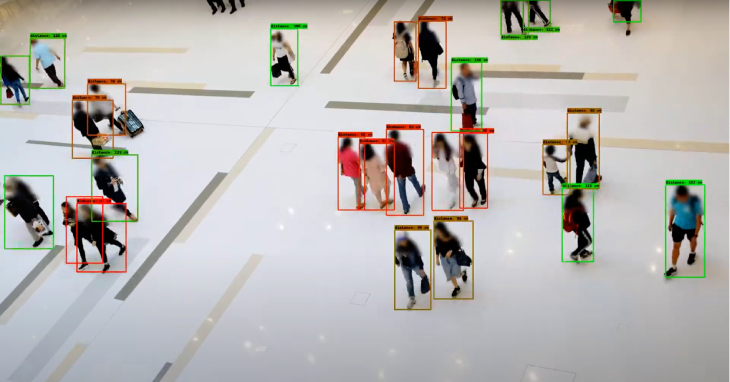
Our approach uses artificial intelligence and computing devices from personal computers to AI accelerators such as NVIDIA Jetson or Coral Edge TPU to detect people in different environments and measure adherence to social distancing guidelines. The Smart Social Distancing application provides statistics to help users identify crowded hotspots and can give proper notifications every time social distancing rules are violated.
2.1. A High-Level Perspective
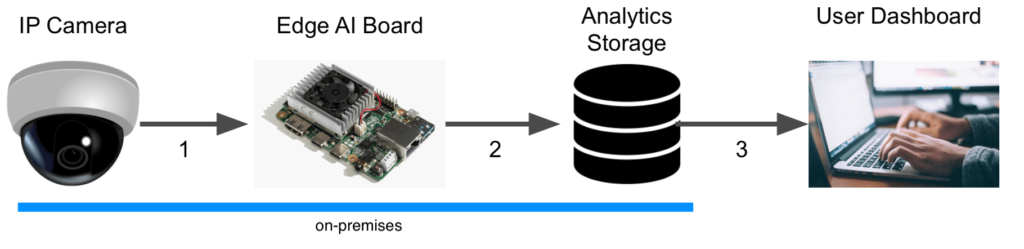
Smart Social Distancing application uses existing cameras to analyze physical distancing measures. The video will be streamed from a video feed to the main device, such as an Edge AI board or a personal computer. The main device processes the video and writes the analytical data on external storage. Analytical data only include statistical data, and no video or identifiable information is stored. Different graphs and charts visualize these statistics in the Dashboard. The user can connect to the Dashboard and view the analytical data, export it, and make decisions.
The user can access the Dashboard from a web browser. To ensure security and ease of development, requests to read the analytical data are sent directly to the main device by the web browser. As long as these requests and responses are encrypted, the Dashboard server cannot access the board’s stream and the analytical data. Since no data needs to be stored on the cloud, and no video file is stored on the analytics storage, the Smart Social Distancing application completely preserves the users’ privacy.
3. Codebase Architecture
We have achieved shippability and accessibility by “Dockerizing” the Smart Social Distancing application. The application architecture consists of two main parts that should be run separately; the Dashboard and the Processor.
The Dashboard consists of a React application served by a FastAPI backend, which provides the user with the necessary tools to communicate with the board and visualize the analytical data.
The Processor consists of an API and a Core; the Core is where the AI engine and the application logic are implemented. The API receives external commands from the user and communicates with the Core.
We will explain each component in more detail in the following sections.
3.1. Dashboard: an Overview
The Dashboard is where the visualizations happen; the user can find various charts and diagrams to better understand the measured statistics. The Dashboard interface is a React app served by a FastAPI backend.
The Dashboard consists of two Dockerfiles:
-
frontend.Dockerfile web-gui.Dockerfile
To run the Dashboard, you should build the frontend before building the web-GUI Dockerfile. Building the Dashboard is resource-intensive, and It is troublesome to build the Dashboard on devices with limited memory, such as Coral Edge TPU. Therefore, we have separated the Dashboard from the Processor to enable users to skip building the Dashboard if they wish to. However, the users would not encounter any problem building the Dashboard on other supported devices with higher capacities, such as X86 and most Jetson platforms.
Since the Dashboard is separated from the Processor, even if the Processor is not running, the user can still read the old statistics from the analytics server (of course, if the analytics server is accessible). However, any request to the Processor’s API will be failed, indicating that the Processor is not accessible at the time. On the other hand, regardless of whether the Dashboard is running or not, the Processor can run independently on the main device and store the statistics on the analytics storage. Users can access these statistics through the Dashboard at any time.
3.2. Technical Notes
If you plan to make changes to the web-GUI Dockerfile, you need to ensure that you are using the latest version of the frontend Docker image. Otherwise, some inconsistencies may occur.
3.3. Processor: an Overview
The application API, the AI core, and all the mathematical calculations to measure social distancing have been implemented in the Processor.
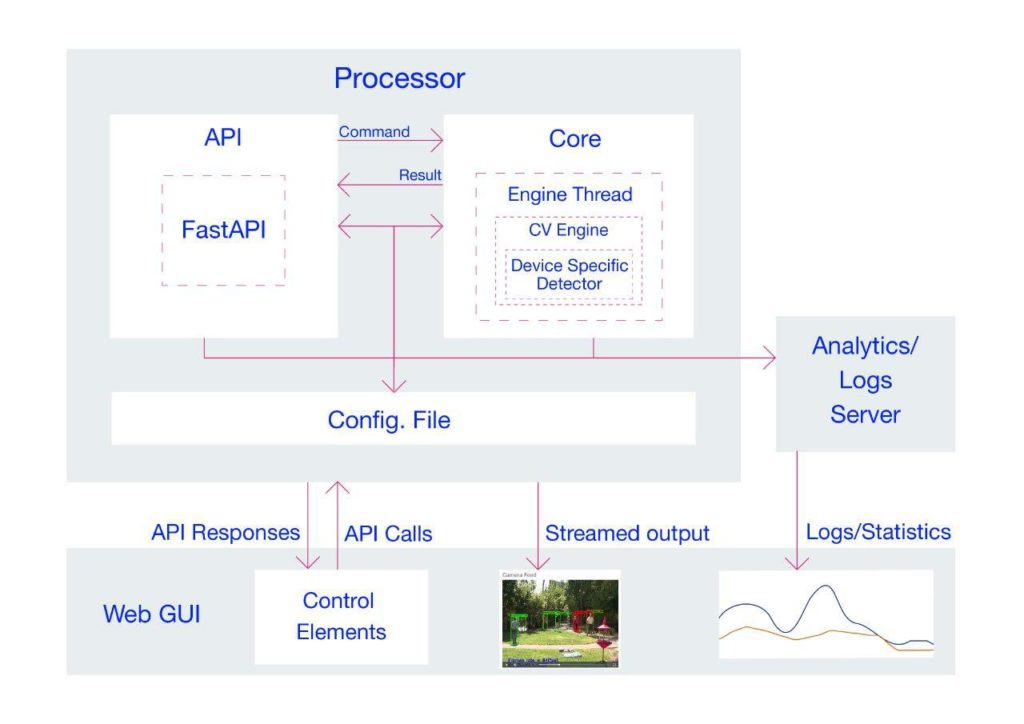
The Processor is made up of two main components; the Processor API and the Processor Core. The Processor API receives an API call from the outside world (the user) and sends a command to the Processor Core. The Core communicates with the API and sends the response according to the received command (if approved). Two queues, shared between the Core and the API, store the API commands and responses and enable the Core and the API to communicate.
Figure 2 illustrates the different components of the Processor. The arrows indicate the relations between these components. In the following sections, each component will be explained in more detail.
Processor Core
The Processor Core is where the AI engine and the application logic is implemented. The Core itself has several components and listens to the Processor’s API on a queue called the cmd_queuecmd_queue
Deep learning algorithms are implemented in a component named CvEngine (which is an alias for the Distancingcomponent in our implementation). CvEngine is responsible for processing the video and extracting statistical information. Note that some of the implemented algorithms, such as pedestrian detection, are device-specific, whereas other parts, extracting social distancing violations, for instance, are common between all the supported devices.
The Core keeps track of the tasks at hand and acts according to the received command. When the Core receives a command, it puts the proper response on a queue called the result_queueresult_queue for the response. Note that the Processor Core creates these queues, and the API registers them. If the Core component is not ready yet, the API will wait until the Core is up and ready and the queues are accessible. We will explain these commands and their responses in more detail in the following sections.
Processor API
The Processor API is where the external requests (by the user) are received. By these requests, we mean the supported API endpoints. Here is a list of supported commands with a description of what they do:
| API Endpoint | Description |
|---|---|
| PROCESSOR_IP:PROCESSOR_PORT/process-video-cfg | Sends command PROCESS_VIDEO_CFG to the Core and returns the response. It starts to process the video addressed in the configuration file. A true response means that the Core will try to process the video (with no guarantee), and a false response indicates that the process cannot start now. For example, it returns false when another process is already requested and running. |
| PROCESSOR_IP:PROCESSOR_PORT/stop-process-video | Sends command STOP_PROCESS_VIDEO to the Core and returns the response. It stops processing the video at hand and returns a true or false response depending on whether the request is valid or not. For example, it returns false when no video is already being processed to be stopped. |
| PROCESSOR_IP:PROCESSOR_PORT/get-config | Returns the config used by both the Processor’s API and Core. Note that the config is shared between the API and Core. This command returns a single configuration set in the JSON format according to the config-*.ini file. |
| PROCESSOR_IP:PROCESSOR_PORT/set-config | Sets the given set of JSON configurations as the config for API and Core and reloads the configurations. Note that the config is shared between the API and the Core. When setting the config, the Core’s engine restarts so that all the methods and members (especially those initiated with the old config) can use the updated config. This attempt will stop processing the video – if any. |
Some requests are directly related to the Core, such as process-video-cfgset-configCvEngine
3.4. Technical Notes
The start_services.bashrun_processor_core.pyrun_processor_api.py
To start processing the video by default when everything is ready, the sample_startup.bashprocess-video-cfg
3.5. Configurations
The Smart Social Distancing application uses two config files; config-frontend.iniconfig-*.ini
config-*.iniConfigEngineconfig-*.iniConfigEngine constructor. Therefore, they use the same configurations until a request is made by the user to set the config file.
When the set-configstop-process-videoprocess-video-cfgprocess-video-cfg
A key point about the config files is how to set the host and port. In config-frontend.iniProcessorApp section in this config file specifies the host and port on which the Dashboard is accessible. In config-*.iniconfig-frontend.ini
For example, let us say we want to run the Processor on port 2023, and for some customization reasons, we have changed the Processor’s Dockerfile so that the Processor API should use port 8040 inside the Docker (the default is on 8000). We should apply the following changes before running the application:
- Change the API port in
config-*.ini - Change the Processor port in
config-frontend.ini - Forward port 8040 of the Processor’s Docker to the
HOST_PORT
docker run -it --runtime nvidia --privileged -p 2023:8040 -v "$PWD/data":/repo/data -v "$PWD/config-jetson.ini":/repo/config-jetson.ini neuralet/smart-social-distancing:latest-jetson-nano
There are some other parameters that you can change in the config-*.ini[Detector]MinScoreDistThresholdconfig-*.ini
The config files are copied to the Docker images when they are built. Be aware that if you change the config files, you need to rebuild the Docker images to make sure the application is using the latest versions of the config files. The build time will be much less than the first time you build the Docker images because the copying will take place in the last layers of the Docker files. Therefore, the Docker images use the previously built Docker layers and only copy the necessary files into the new image.
4. The Application Logic
Most of the Smart Social Distancing application’s mathematical calculations are implemented in the Distancinglibs/distancing.pyDistancingcalculate_box_distances
We will now explain the building blocks of the Distancing
4.1. Image Pre-Processing and Inference
The __processDetector
By default, Smart Social Distancing uses SSD-MobileNet-V2 trained on the SAIVT-SoftBio dataset by Galliot for inference. Other possible models for your device are written as comments in the config file that matches your device name. In this file, you can change the Name parameter under the [Detector]
At Galliot, we have trained the Pedestrian-SSD-MobileNet-V2 and Pedestrian-SSDLite-MobileNet-V2 models on the Oxford Town Centre dataset to perform pedestrian detection using the Tensorflow Object Detection API. We experimented with different models on both Jetson Nano and Coral Dev Board devices. See Table 2 for more details.
| Device Name | Model | Dataset | Average Inference Time (ms) | Frame Rate (FPS) |
|---|---|---|---|---|
| Jetson Nano | SSD-MobileNet-V2 | COCO | 44 | 22 |
| Coral Dev Board | SSD-MobileNet-V2 | Oxford Town Centre | 5.7 | 175 |
| Coral Dev Board | SSD-MobileNet-V2-Lite | Oxford Town Centre | 6.1 | 164 |
4.2. Bounding Box Post-Processing
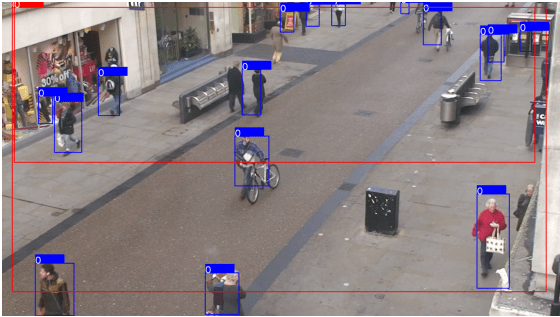
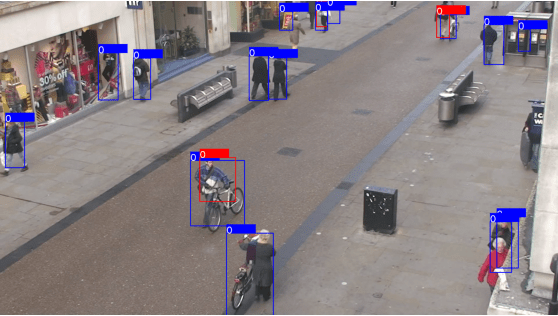
Some post-processing techniques are applied to the detected bounding boxes before calculating distances to minimize errors. There are some reasons to apply post-processing techniques. First, since we are using a general-purpose object detection model trained on COCO with 80 different classes, including pedestrians, there are some false positive outputs for the pedestrian detection task. These false positives are often seen in the form of extra-large boxes (Figure 3) or duplicate boxes specifying a single object (Figure 4). In the following lines of code, we address these two problems by filtering large and duplicate boxes:
new_objects_list = self.ignore_large_boxes(objects_list)
new_objects_list = self.non_max_suppression_fast(new_objects_list,
float(self.config.get_section_dict("PostProcessor")["NMSThreshold"]))
The second reason to apply post-processing is to track objects smoothly. In the absence of post-processing, the object detection model may lose track of the detected pedestrians from one frame to the other. This issue can be solved by designing a tracker system that follows the detected pedestrians in different frames.
tracked_boxes = self.tracker.update(new_objects_list)
4.3. Calculating Distances
The __processcalculate_distancing
There are a few methods to calculate the distance between two rectangles; however, choosing the right approach to measure this distance depends on different specifications, such as the data characteristics and the camera angle. Since some measures, such as the distance between the camera to the center of the bounding boxes or the depth data, are not available in most cases, we implemented a calibration-less method as well as a calibrated one. The calibrated method is more accurate than the calibration-less method. However, the latter is easier to implement. Let us explain more about each method.
Calibration-less Method
In this approach, we map the distances in the image (in pixels) to physical distance measures (in meters), by assuming that each person is H = 170 cmLL1L2L3L4
1- Assume that L = L1 = L2 = L3 = L4
2- Assume that L = min (L1, L2, L3, L4)
Following the first assumption makes the approach easier to understand with fewer amount of calculations needed. However, the second method produces more accurate results.
We explain how to calculate L1 in this section. If you want to use the first method, put L = L1L by setting it equal to the minimum value of L1L4. It is trivial that you can calculate L2L3L4
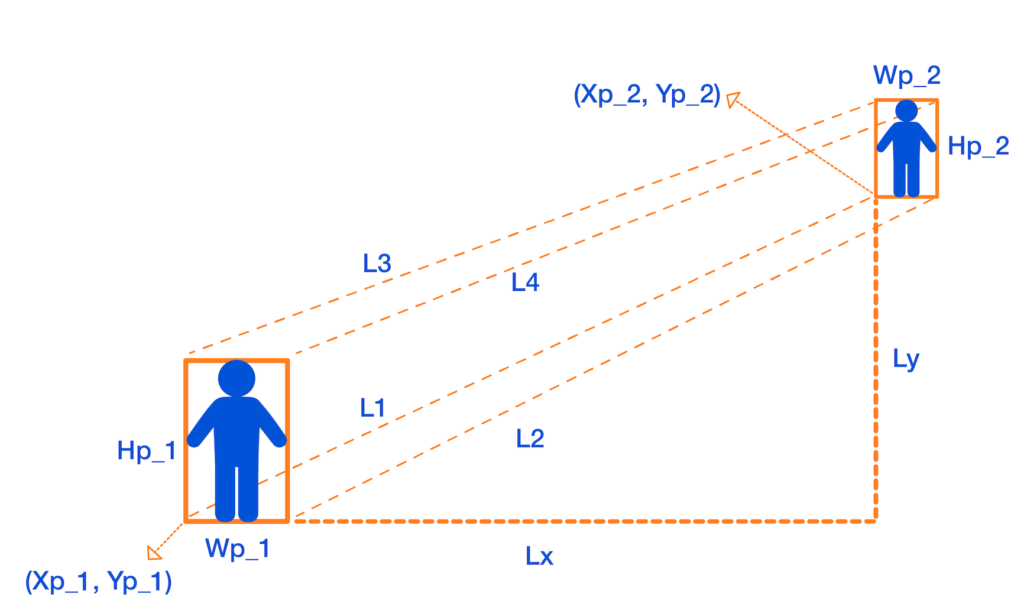
To measure L1DXDY
DX = Xp_1 - Xp_2
DY = Yp_1 - Yp_2
Then, by the H = 170 cm
Lx = DX * ((1 / H1 + 1 / H2) / 2) * H
Ly = DY * ((1 / H1 + 1 / H2) / 2) * H
Finally, we apply the Pythagorean formula to get L1:
L1 = sqrt(Lx + Ly)
We can now calculate L
In your device config file,
– You can set the DistMethodPostProcessorCenterPointsDistanceFourCornerPointsDistanceLL = min (L1, L2, L3, L4)
– The minimum physical distancing threshold is set to 150 centimeters by default. You can set a different threshold for physical distancing by changing the value of DistThreshold
Calibrated Method
The calibrated method takes in a homography matrix and calculates the real-world distances by transforming the 2D coordinates of the image to the real-world 3D coordinates. We will explain how this method works in a separate post.
4.4. Data Visualizations
Some data visualizations are provided to give the user better insights into how well physical distancing measures are being practiced. The data analytics and visualizations can help decision-makers identify the peak hours and detect the high-risk areas to take effective actions accordingly.
The visualizations include a camera feed, a birds-eye view, the pedestrian plot, and the environment score plot.
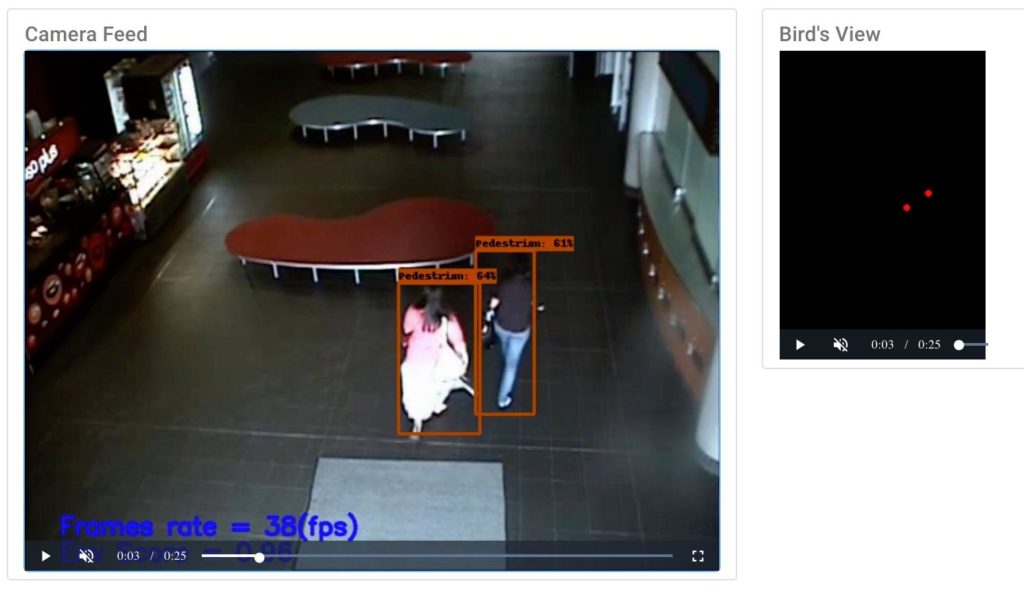
Camera Feed
The camera feed shows a live view of the video being processed (see Figure 6). Colored bounding boxes represent detected pedestrians. You can see the frame rate and environment score (explained below) at the bottom of the video screen.
Birds-eye View
This video shows the birds-eye view of the detected pedestrians (see Figure 6). The red color indicates a social distancing violation, while the green color represents a safe distance between the detected pedestrians in each frame.
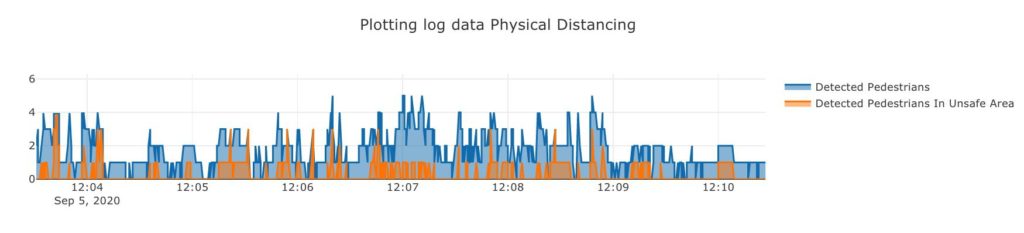
Pedestrian Plot
The pedestrian plot (Figure 7) shows the total number of detected pedestrians (the blue graph) and the number of detected pedestrians who are violating the physical distancing threshold (the orange graph) over time.
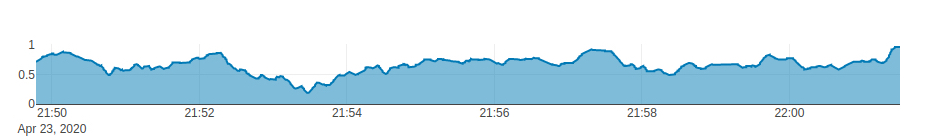
Environment Score Plot
This plot (Figure 8) shows the “environment score” over time. The environment score is an index defined to evaluate how well social distancing measures are being practiced in an environment. Two different formulas are implemented to measure the environment score in tools/environment_score.py
1- The mx_environment_scoring
env_score = 1 - np.minimum((violating_pedestrians / MAX_ACCEPTABLE_CAPACITY), 1)
Note that MAX_ACCEPTABLE_CAPACITYDistThresholdMAX_ACCEPTABLE_CAPACITY
2- The mx_environment_scoring_consider_crowd
env_score = 1 - np.minimum(((violating_pedestrians + detected_pedestrians) / (MAX_CAPACITY + MAX_ACCEPTABLE_CAPACITY)), 1)
In this formula, the MAX_CAPACITY
Note that in both formulas, the environment score takes a value between 0 to 1, and the more violating cases appear in a frame, the less the environment score of that frame becomes.
4.5. Data Logging System
We have implemented a logging system for the Smart Social Distancing application that can be very useful for data analytics. By storing statistical data, such as the overall safety score, the number of people in the space over the past day, and total risky behaviors, users can gain insights into different social distancing measures. Let us explore how the logging system works.
There are three files under the libs/loggerscsv_processed_logger.pycsv_logger.pyloggers.py
The first two scripts implement their update method that is called from the loggers.pyupdate
NameTimeIntervalLogDirectory
The update method in the csv_processed_logger.py
The csv_logger.py
- The object log keeps track of the information about all the detected objects in each time interval. Frame number, person id, and bounding box coordinates are stored in this log file.
- The distance log stores the details of physical distancing violation incidents, such as the time in which physical distancing rules are violated, the id of the persons crossing the distance threshold, and the distance they are standing from each other.
Please reach out to hello@galliot.us if you have any questions. Check out our GitHub page for other models and applications by Galliot.
Leave us a comment
Comments
Get Started
Have a question? Send us a message and we will respond as soon as possible.
Hello just wanted to give you a quick heads up and let you know a few of the pictures aren’t loading correctly. I’m not sure why but I think its a linking issue. I’ve tried it in two different web browsers and both show the same outcome.
I appreciate your piece of work, thanks for all the good blog posts.